|
Dinucleotides
- Isomerization Properties
  All
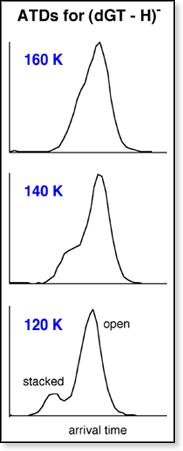
of the 80 K ATDs show multiple peaks indicating that the dinucleotides
have different conformations. Each peak has been identified
as the stacked, H-bonded, or open form. However,
as the temperature inside the drift cell increases, the ATD peaks begin
to merge, eventually forming one symmetric peak between 200 and 400 K
(shown at left). All
of the 80 K ATDs show multiple peaks indicating that the dinucleotides
have different conformations. Each peak has been identified
as the stacked, H-bonded, or open form. However,
as the temperature inside the drift cell increases, the ATD peaks begin
to merge, eventually forming one symmetric peak between 200 and 400 K
(shown at left).
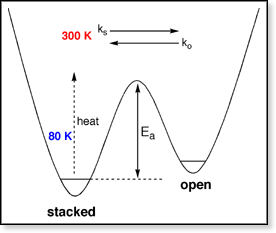
This
merging is a sign that the different conformers are starting to isomerize.
Another way to look at it is shown above at right. For each dinucleotide,
at least two conformers are present that must be separated by some barrier
with energy Ea. At low temperatures (and hence low internal
 energy),
each conformer remains in its respective well and they can be separated
in the drift cell (appearing as separate peaks in the ATD). As the temperature
is raised, the internal energy increases and eventually surpasses Ea,
allowing the two conformers to interconvert. At this point the separate
peaks in the ATD begin to merge since the ion spends time in the drift
cell in each conformation. At high enough temperatures, the two conformers
can interconvert fast enough that they yield a single, time-averaged peak
in the ATD. The question is: Can we get an estimate of the height of the
isomerization barrier? energy),
each conformer remains in its respective well and they can be separated
in the drift cell (appearing as separate peaks in the ATD). As the temperature
is raised, the internal energy increases and eventually surpasses Ea,
allowing the two conformers to interconvert. At this point the separate
peaks in the ATD begin to merge since the ion spends time in the drift
cell in each conformation. At high enough temperatures, the two conformers
can interconvert fast enough that they yield a single, time-averaged peak
in the ATD. The question is: Can we get an estimate of the height of the
isomerization barrier?
The
shape of the ATD will depend on how fast the conformers isomerize as they
drift through the cell. The slower the interconversion process, the more
distinct the peaks become in the ATD. A theoretical model for ATDs, taking
into consideration that the ion may be reacting to form another species,
has been published by I.R. Gatland [Gatland, I.R. Case Studies in Atomic
Physics 1974, 4, 369-437]. We have modified this program
to fit our situation of one conformation isomerizing into a different
conformation. In the modeling, the only unknown variables are the rate
constants for isomerization. That is, k for the stacked  open conversion and k for the open
stacked conversion, etc.
open conversion and k for the open
stacked conversion, etc.
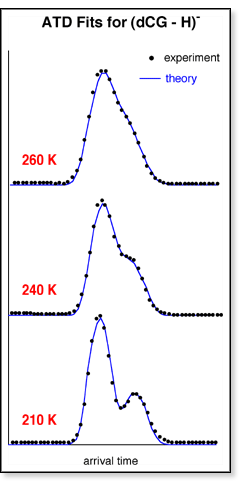
 The
experimental ATDs are then fit with this model by adjusting the various
rate constants until the shape of the theoretical ATD matches that of
the experimental ATD. An example of the fits is shown above. The
experimental ATDs are then fit with this model by adjusting the various
rate constants until the shape of the theoretical ATD matches that of
the experimental ATD. An example of the fits is shown above.
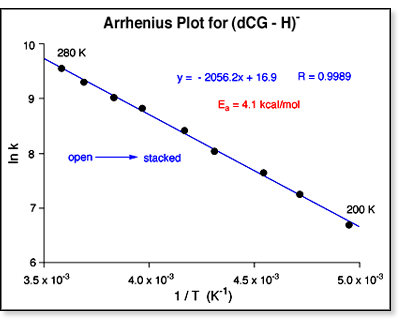
Since
the ATDs are fit over a series of temperatures, the rate constants k are
known as a function of temperature. Thus, a simple Arrhenius plot will
yield the barrier height, Ea.
For
the dinucleotides with two conformers present, the ATD fits are relatively
straightforward: stacked
open, open stacked,
stacked H-bonded,
H-bonded stacked.
An example of an Arrhenius plot for a two-conformer 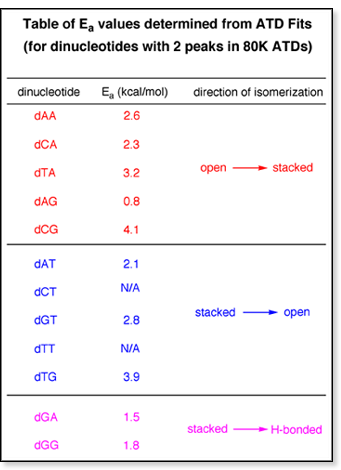 system
is shown above at left. A summary of the barrier heights for all the two-conformer
systems is shown in the table at right. system
is shown above at left. A summary of the barrier heights for all the two-conformer
systems is shown in the table at right.
For
dAC, dCC, dGC, and dTC, the problem of fitting the ATDs is more complex.
Three conformers are observed for each system and the theoretical model
was only developed to handle two reacting species. Additionally, it is
difficult to tell which conformer isomerizes into what. For example, does
the isomerization follow stacked
H-bonded open
or does the stacked form isomerize directly into an open
form?
For
dAC, dGC, and dTC, the isomerization of all three conformers takes place
between 100 and 200 K, making it difficult to determine the order of isomerization.
For dCC, however, two peaks are still present in the 300 K ATDs (below).
The
cross section obtained from the shortest-time peak in the 300 K ATD agrees
very well with the theoretical value of the stacked conformer (132
± 1 Å2 vs. 130 ± 2 Å2).
Therefore, this peak most likely represents only the stacked form
and is not a mixture of conformers. The cross section from the longest-time
peak in the 300 K ATD (146 ± 1Å 2),
on the other hand, falls between the theoretical values of the H-bonded
form (142 2),
on the other hand, falls between the theoretical values of the H-bonded
form (142 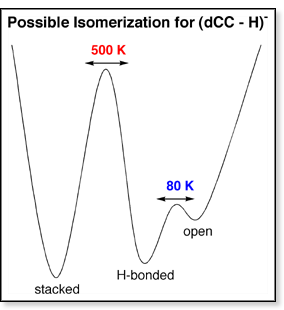 ±
2 Å2), and the open form (152 ± 2 Å2).
Therefore, this peak is most likely a combination of the H-bonded
and open forms. ±
2 Å2), and the open form (152 ± 2 Å2).
Therefore, this peak is most likely a combination of the H-bonded
and open forms.
The
ratio of the two peaks in the 300 K ATD is 1:3. In the 80 K ATD, the ratio
of the three peaks is 1:2:1. Thus, only the H-bonded and open
forms are isomerizing at low temperatures and the stacked form
does not get involved in the isomerization process until ~400 K. A possible
reaction coordinate diagram describing the isomerization of dCC is shown
above. Because
the H-bonded and open conformers isomerize between 100 and
200 K, the barrier between these two forms must be small. The stacked
form, however, does not begin to isomerize until 400-500 K, suggesting
a larger barrier. The stacked form most likely isomerizes into
the H-bonded form or at least goes through an H-bonded intermediate.
Assuming this scenario, the two barrier 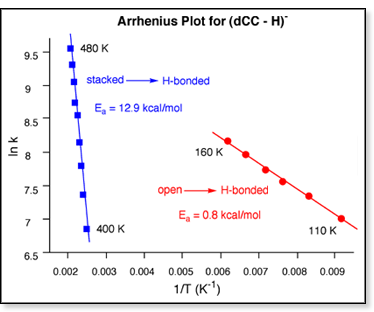 heights
can be determined by modeling the dCC ATDs at two different temperature
ranges. Between 80 and 200 K, the experimental ATDs were fit using only
the rate constants for the H-bonded
open and open
H-bonded conversions (and ignoring the fastest-time peak in the
ATD which corresponds to the stacked form). Between 400 and 500
K, the experimental ATDs were fit using only the rate constants for the
stacked H-bonded
and H-bonded stacked
conversions. The resulting Arrhenius plots are shown at right. heights
can be determined by modeling the dCC ATDs at two different temperature
ranges. Between 80 and 200 K, the experimental ATDs were fit using only
the rate constants for the H-bonded
open and open
H-bonded conversions (and ignoring the fastest-time peak in the
ATD which corresponds to the stacked form). Between 400 and 500
K, the experimental ATDs were fit using only the rate constants for the
stacked H-bonded
and H-bonded stacked
conversions. The resulting Arrhenius plots are shown at right.
|