|
Dinucleotides
- Experimental Results - ATDs
Typical
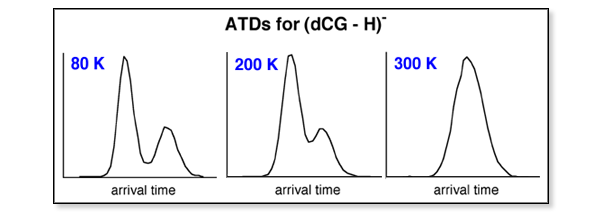
ATDs for the deprotonated dinucleotides, measured at different drift temperatures
using the MALDI-Sector
instrument, are shown below. At 300 K and higher temperatures, only
one peak appears in the ATDs. However, multiple peaks are present in the
lower-temperature ATDs. Since the ions are mass-selected before they enter
the drift cell and the injection energies are kept low enough to prevent
significant fragmentation, the multiple peaks in the ATDs must represent
different conformations (with significantly different collision cross
sections) of the dinucleotide ion.

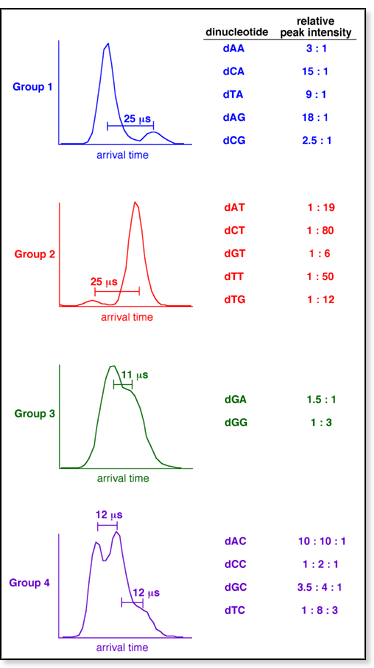
 The
number of peaks in the 80 K ATDs and their relative intensities are base-
and sequence-dependent. However, each dinucleotide can be grouped into
one of four distinct categories based on similarities observed in the
ATDs. These groups and their 80 K ATDs are shown at right. The
number of peaks in the 80 K ATDs and their relative intensities are base-
and sequence-dependent. However, each dinucleotide can be grouped into
one of four distinct categories based on similarities observed in the
ATDs. These groups and their 80 K ATDs are shown at right.
In Group 1,
two peaks are present in the 80 K ATDs and are separated by 25 μs
(corresponding to a difference in cross section of 20-22 Å2).
The shortest-time peak is always more intense than the longest-time peak.
The dinucleotides dAA, dCA, dTA, and dAG, dCG are members of this group.
In Group 2,
two peaks are also present in the 80 K ATDs and again separated by 25
μs. However, in this case, the longest-time
peak is always more intense than the shortest-time peak. The dinucleotides
dAT, dCT, dGT, dTT, and dTG are members of this group.
In Group 3,
two peaks are present in the 80 K ATDs and are separated by 12 μs
(corresponding to a difference in cross section of 10-12 Å2).
The dinucleotides dGA and dGG are members of this group.
In Group 4,
three peaks are present in the 80 K ATDs. Each one is separated by 12
μs. The intermediate-time peak is always the
most intense peak in the spectra. The dinucleotides dAC, dCC, dGC, and
dTC are members of this group.
|

