|
This
technique is used to determine enthalpy and entropy changes for equilibrium
reactions of the type shown below.

Temperature-dependent
equilibrium experiments have been used extensively in the Bowers group
to obtain thermodynamic information for reactions of transition metal
cations M+ with ligands L such as H2 and CH4.
More recently, this method has been used to investigate hydration (L=H2O)
of singly- and multiply-charged peptide cations and anions.
The
equilibrium experiments are carried out in the Bowers group on the Quad-Cell-Quad and ESI instruments. The
key component in each of these instruments is the drift cell where the
equilibrium reaction takes place. The cell temperature can be precisely
controlled such that experiments can be performed anywhere in a range
from approximately 80 K (the temperature of liquid N2 at atmospheric
pressure) up to as high as 800 K. The temperature within the drift cell
is monitored using platinum resistors and/or thermocouple gauges which
 are
attached inside and outside the cell within the vacuum chamber. Multiple
temperature readings are useful for detecting any temperature gradients
across the cell. Cooling is accomplished using a controlled flow of dry
nitrogen gas which has been chilled using liquid nitrogen. Heating is
accomplished either by heating the flow of nitrogen gas using external
heaters or by electrical heaters imbedded within the drift cell itself.
With some care, temperatures can be kept within about ±0.5 K. The
drift cell is filled with several Torr of the reactant gas L whose pressure
is measured using a capacitance manometer (a Baratron unit, usually equipped
with a 10 Torr head). are
attached inside and outside the cell within the vacuum chamber. Multiple
temperature readings are useful for detecting any temperature gradients
across the cell. Cooling is accomplished using a controlled flow of dry
nitrogen gas which has been chilled using liquid nitrogen. Heating is
accomplished either by heating the flow of nitrogen gas using external
heaters or by electrical heaters imbedded within the drift cell itself.
With some care, temperatures can be kept within about ±0.5 K. The
drift cell is filled with several Torr of the reactant gas L whose pressure
is measured using a capacitance manometer (a Baratron unit, usually equipped
with a 10 Torr head).
 After
the ensuring that the temperature of the drift cell and its contents is
stable, equilibrium measurements can be made. Mz+/- ions are
injected into the cell containing the reactant gas L to form Mz+/-·Ln
clusters . At the relatively high pressures of the cell, the ions are
quickly thermalized by collisions with the neutral gas. The ions drift
through the cell under the influence of a weak electric field which only
marginally perturbs their thermal energies. After
the ensuring that the temperature of the drift cell and its contents is
stable, equilibrium measurements can be made. Mz+/- ions are
injected into the cell containing the reactant gas L to form Mz+/-·Ln
clusters . At the relatively high pressures of the cell, the ions are
quickly thermalized by collisions with the neutral gas. The ions drift
through the cell under the influence of a weak electric field which only
marginally perturbs their thermal energies.
Ions
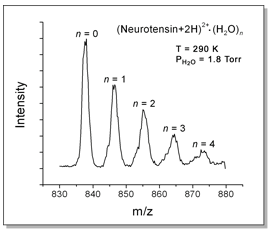
exiting the drift cell are mass-analyzed with a quadrupole. An example
of a resulting mass spectrum is shown above for the 13-amino-acid peptide
neurotensin. The doubly-protonated ion binds up to 4 water molecules when
it is exposed to 1.2 Torr of water vapor in the cell at 290 K.
The
amount of time that the ions spend in the cell is directly proportional
to the cell pressure and inversely proportional to the electric field
(see Ion Mobility Theory). By
adjusting the pressure and the voltage across the cell, the reaction time
can be controlled. It is important to make certain that the drift time
is long enough to ensure equilibrium of the reaction has been achieved.
To do this, mass spectra of the ions exiting the drift cell are measured
as a function of drift time. If the relative intensities of the peaks
remain unchanged as drift time is increased, equilibrium conditions have
been met. This is illustrated in the series of spectra shown at left.
As drift time is increased from 900 to 2700 μs,
the relative peak heights stay the same.
Since
the intensities of the peaks in the mass spectra are proportional to the
concentrations of the corresponding ions in the drift cell, the equilibrium
constants K of the reactions can be determined using the equation
below.

In
this expression, I(Mz+/-·Ln)
is the product ion intensity, I(Mz+/-·Ln-1)
is the reactant ion intensity, P0 is the standard-state
pressure and PL is the pressure of the neutral reactant
in the drift cell. The equilibrium constants can then be used to calculate
standard-state Gibb's free energies  using the expression below where R is the gas constant and T
is the temperature.

 Enthalpy
and entropy changes, Enthalpy
and entropy changes,  and and  ,
respectively, for the equilibrium reaction can be obtained by plotting ,
respectively, for the equilibrium reaction can be obtained by plotting
 versus T. This yields
a straight line with an intercept equal to versus T. This yields
a straight line with an intercept equal to  and a slope equal to -
 .* .*

The
values determined by this method are valid over the temperature range
of the experiment. Bond dissociation energies at T = 0 K (- )
can obtained for simpler systems by fitting the experimental data using
a statistical mechanical model based on
vibrational frequencies and molecular geometries obtained, for example,
from DFT calculations. )
can obtained for simpler systems by fitting the experimental data using
a statistical mechanical model based on
vibrational frequencies and molecular geometries obtained, for example,
from DFT calculations.
* Note: This
is equivalent to the more usual van't Hoff plot of log(K) vs. 1/T.
|


