
 |

|
||||||||
|
3-mer Dynamics - Na+PET3 |
||||||||
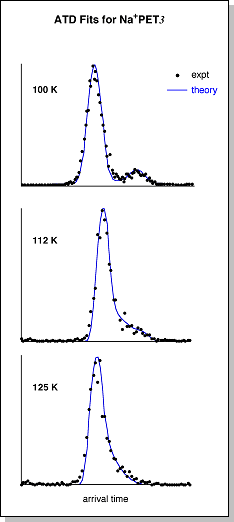
 The
80 K ATD for Na+PET3
shows two peaks separated by ~25 μs, corresponding
to a difference in cross-section of 22 ± 2 Å2. The
larger peak at shorter drift times can be reasonably assigned to the "closed"
form while the smaller peak at longer drift times can be assigned to the
"open" form. As the temperature
of the drift cell is raised, the two peaks begin to merge into each other,
eventually forming one peak at ~180 K (shown at right) The
80 K ATD for Na+PET3
shows two peaks separated by ~25 μs, corresponding
to a difference in cross-section of 22 ± 2 Å2. The
larger peak at shorter drift times can be reasonably assigned to the "closed"
form while the smaller peak at longer drift times can be assigned to the
"open" form. As the temperature
of the drift cell is raised, the two peaks begin to merge into each other,
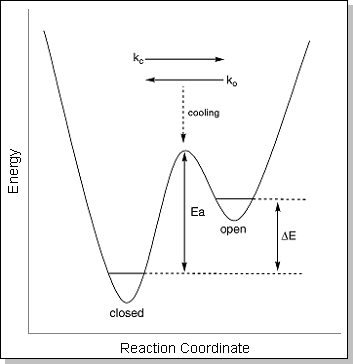
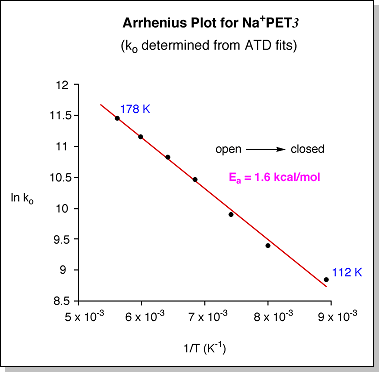
eventually forming one peak at ~180 K (shown at right)This merging of the two ATD peaks indicates that the "closed" and "open" conformers begin to interconvert as they travel through the drift cell as the temperature is raised. A simple schematic diagram describing the isomerization process is shown below. At 300 K, the internal energy in the system is well above the barrier that separates the "closed" and "open" forms. At this point, the two conformers can rapidly interconvert, yielding a single, time-averaged peak in the ATD. As the system is cooled, the internal energy approaches the barrier height and the isomerization process slows down, yielding an ATD with two peaks that are just beginning to separate. Once the internal energy drops below the barrier height, the "closed" and "open" forms can no longer interconvert and they appear as two distinct peaks in the ATD. For ions that have multiple conformations with different drift velocities, the resulting ATD is simply the sum of the individual ATDs of each conformer. If the conformers interconvert as they drift, then the shape of the resulting ATD also becomes dependent on how fast the conformers interconvert (i.e. their rate constants). The temperature-dependent ATDs for Na+PET3 were fit with a theoretical model [I. R. Gatland, Case Stud. At. Phys. 1974, 4, 369] in which the only unknown variables are the "closed" --> "open" rate constant (ko) and the "open" --> "closed" rate constant (kc). Examples of the fits are given as blue lines in the figure below at right. Once the rate constants are known as a function of temperature, an Arrhenius plot of ln k vs. 1/T should yield a straight line with a slope proportional to the barrier height (Ea). A plot of ln ko vs. 1/T (at bottom) determined from the ATD fits for Na+PET3 yields an "open" --> "closed" isomerization barrier of 1.6 ± 0.3 kcal/mol. |
||||||||
 |
 |
|||||||
 |
||||||||